
13·Product
Property Valuation
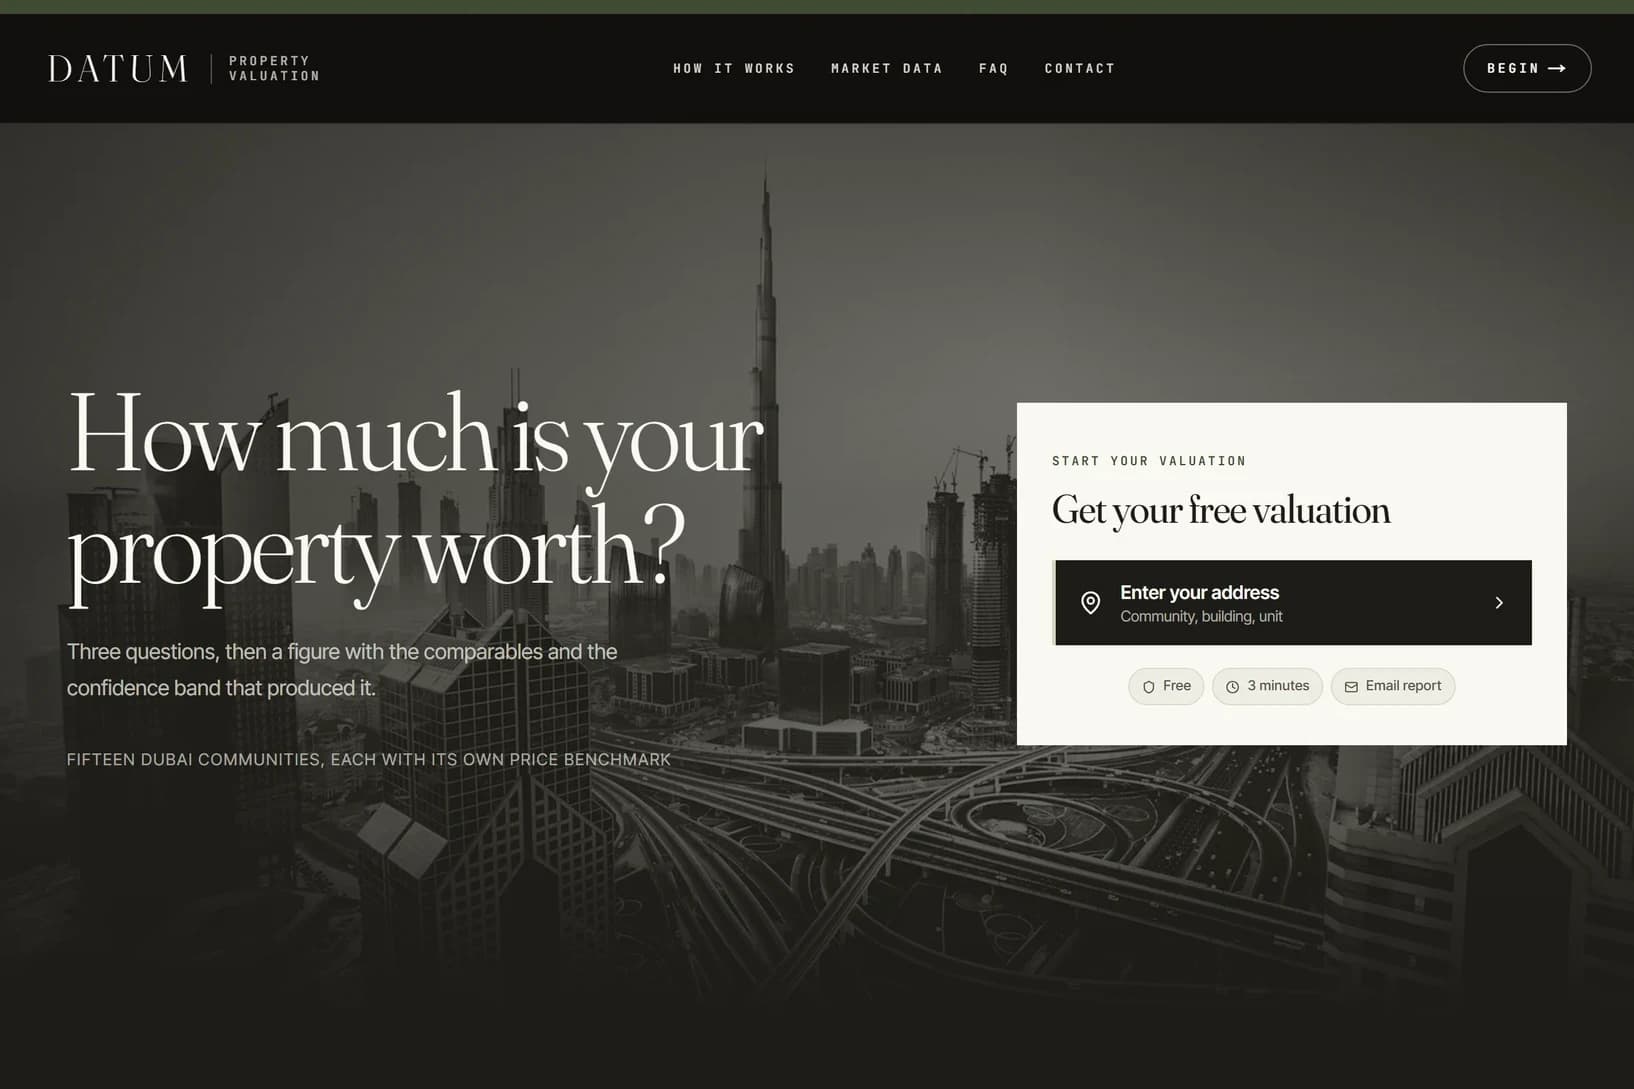
An instant Dubai property valuation that shows its working. A three-step wizard turns an address into a value range, and every figure on the result carries a row naming the source it came from and the month it was read: the community benchmark, each percentage adjustment, the rent, the market trend, the interest rate. The range width is set by which body of evidence answered, so a thin-evidence estimate visibly reads as a wider band rather than hiding behind a number nobody measured.
ResultRebuilt from a plausible demo into something a valuer could read closely.
[ Ask about this build ]01Develop
What it took
Skills behind it.
Primary discipline plus the support stack.
Skills demonstrated
- Frontend EngineeringPrimary
A three-step wizard (address, property details, contact) and a results screen in Next.js 16's App Router: a range bar drawn to scale from the band, an itemised price-adjustment breakdown, an evidence table, a trend-extrapolation panel, comparable sales, a twelve-month trend chart, and location signals from public open data (RTA metro stations, KHDA school inspections, OSM Overpass). The five result surfaces were extracted into shared components so the wizard and the saved report cannot drift apart.
- Backend EngineeringPrimary
Five API routes on Vercel. Estimate runs the pricing engine; lookup resolves a deed or Makani number; lead writes to Vercel Blob and notifies through Resend; email-report sends the result; report persists one to Turso and serves it back at its own URL. The report route recomputes server side and never accepts a client-supplied price, so nobody can publish a fabricated figure on a branded page. Every integration no-ops cleanly rather than erroring when its env var is unset, including the database: with no Turso URL the save button does not render at all, rather than rendering and failing.
- Data PipelinesSecondary
A hand-curated benchmark table, 15 communities, where each row records the published index it was read from and the month. Automated ingest from the Dubai Land Department is closed off (its transaction search is captcha-gated per query and the bulk portal is unreachable), so curation with recorded provenance is the model rather than a stopgap. One row is flagged in place because its villa index does not state whether its per-sqft denominator is built-up area or plot, and the two differ enough to matter.
- Product StrategySupporting
The positioning is the valuation that shows its working. Bayut and Property Finder are black boxes; the differentiator is that every displayed number produces an evidence row inside the engine rather than in the page, which is what stops a figure reaching the screen without provenance. Where a number cannot be sourced the surface says so out loud rather than quietly deriving it from the figure it was meant to explain. Net yield is the sharpest case: it is the number the portals do not publish, and it needs a service charge, which is published in no feed at all. So the charges are curated by hand as a band per community, and the yield is published as a range, because the sources make a single figure indefensible: Downtown Dubai runs from AED 21 per square foot in one tower to 67.88 in another. Three of the fifteen communities have no cited source and therefore no net yield, which the evidence table states plainly.
Develop · Notes
The build, in full.
The decisions on the record - kept off this page so the case study stays a read, not a scroll.
Read the full build notes02Deliver
What shipped.
Rebuilt from a plausible demo into something a valuer could read closely. The estimate used to print a confidence score and a range that contradicted each other, drawn on a bar hardcoded at left 15 percent and width 70 percent, which was decoration shaped like a measurement. Both are gone: one evidence tier now sets one band half-width, the bar is drawn to scale from it, and the four benchmark rows that carried source 'unverified' were replaced with figures naming a published index and the month. Verified against the live production API, which returns a mid of AED 3,210,000 on a band of 2,889,000 to 3,531,000, exactly the curated-benchmark tier's plus or minus 10 percent, and every figure on that card carries an evidence row naming the source it was read from and the period it covers.
By the numbers
Dubai communities
hand-curated, a source recorded per row
API routes
estimate, lookup, lead, email-report, report
range width
set by the evidence tier, not by a score
Frames
Selected from the work.
8 frames
01The product claim is that the valuation shows its working, so every figure names its source and the period it covers. The rows are built in the pricing engine, not the page, which is what stops a number reaching the screen without provenance. Where a figure cannot be sourced the row says so rather than going quiet. 02The range bar is drawn to scale inside a fixed frame, so a wider evidence tier visibly reads as a wider band. It used to be hardcoded at left 15 percent, width 70 percent: decoration that looked like a measurement. 03Every adjustment is itemised rather than folded into one unexplained number. 04Deliberately not drawn on the same chart as the twelve-month trend: both are heuristics, and stacking them into one picture would read as a measurement. 05The comparables and the trend chart say on their face that they are illustrative, because they are derived from the community benchmark rather than pulled from the transaction register. 06The methodology is a link away from the figure, not buried in a terms page. 07Three steps, with the tower name carried through to the estimate. 08The prototype banner is the first thing on the page, above the pitch.