
09·Applied AI
Data Centre
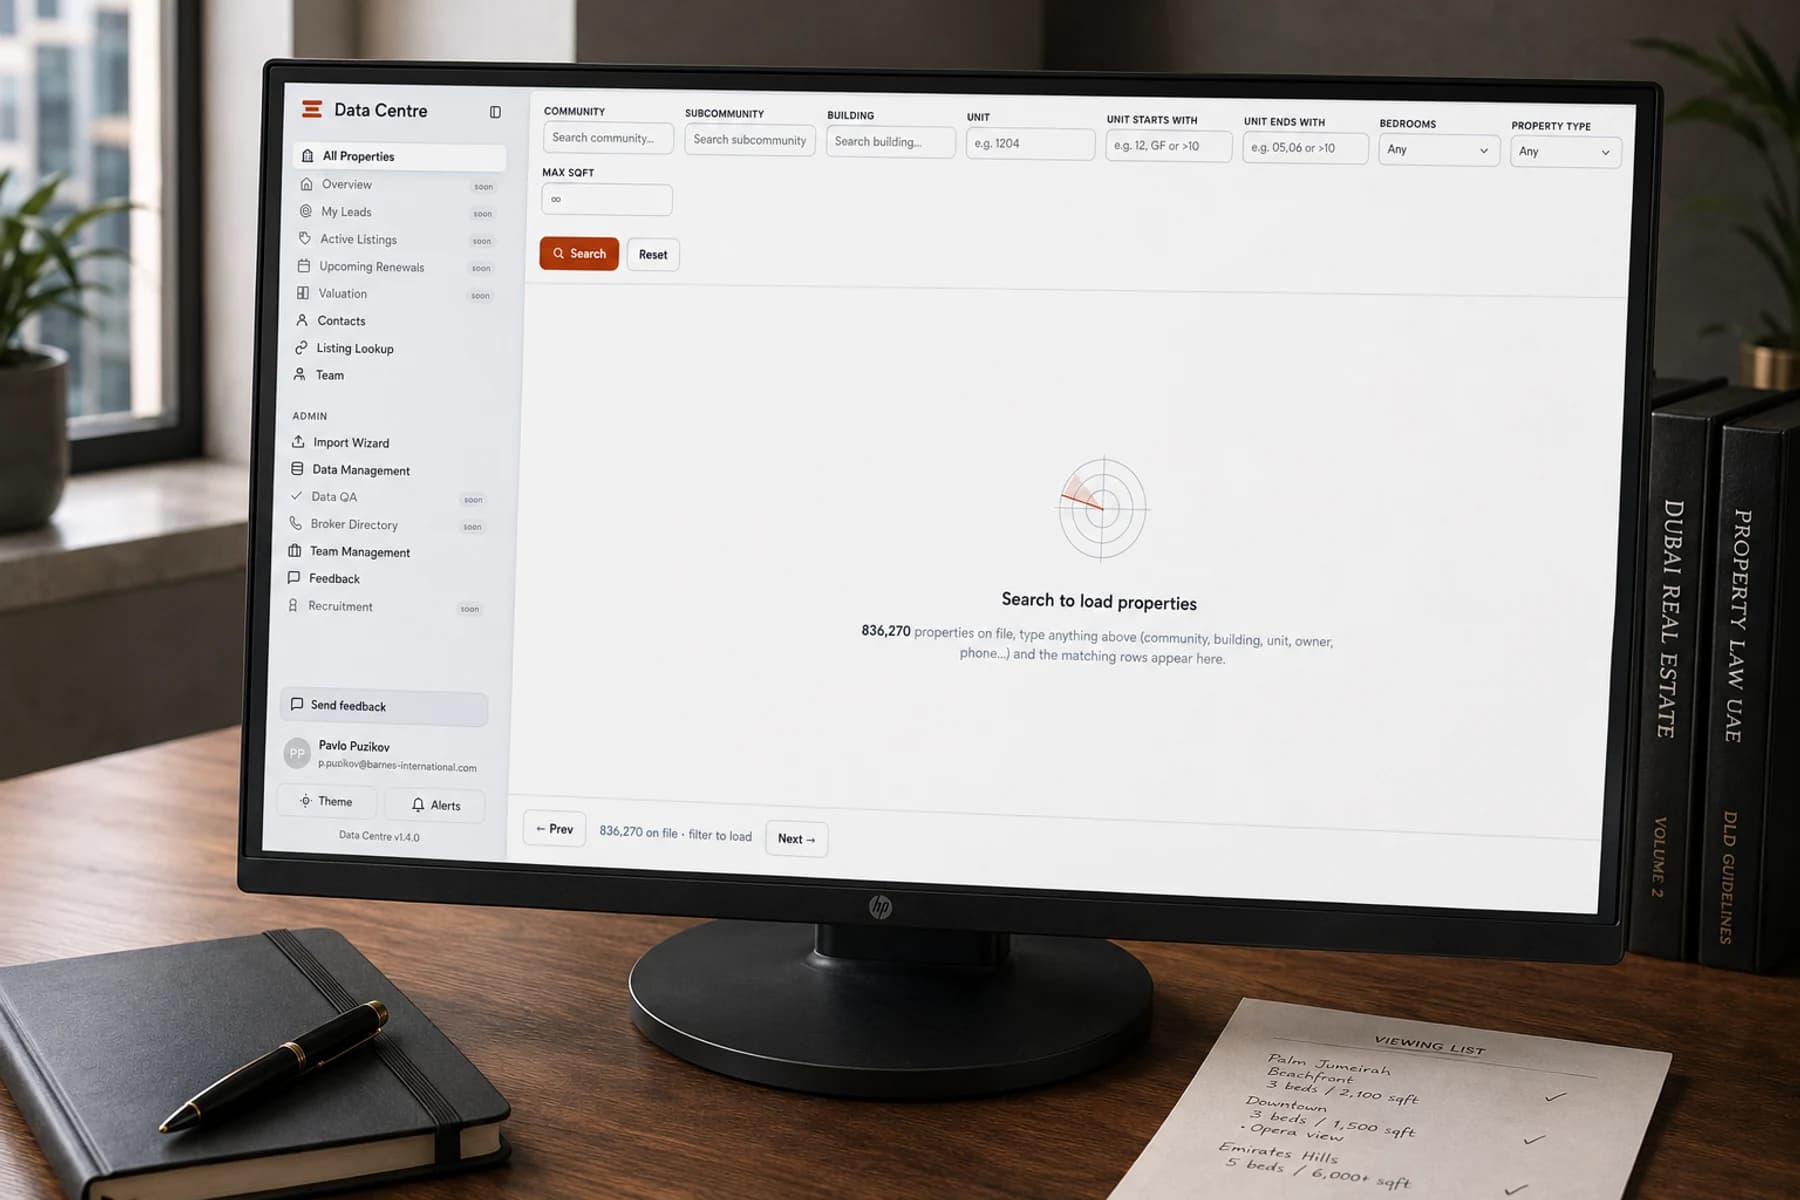
BARNES Dubai's internal data tooling, built in two passes. First: an entity-centric valuation platform and on-demand AVM over the deployed snapshot's 40K+ entities across the 9 sources that had completed an ingest, of 115 connectors registered, backtested to 24.8% (leave-one-out backtest, July 2026) MAPE. Then, absorbed into Data Centre: a front-end and design-system overhaul of the broker-prospecting tool, a single-file PHP monolith over ~840,000 ownership records.
The valuation side turned multi-day analyst cycles into an on-demand AVM brief and surfaced ranked opportunities with an accuracy snapshot the valuation team could audit.
[ Ask about this build ]Why it exists.
BARNES Dubai's valuation team was running multi-day analyst cycles to produce ranked opportunity briefs: pull DLD transactions, cross with KHDA records, eyeball portal scrapes, layer in flood and vegetation risk. Each brief was excellent, and finished a week after the listing had moved.
An entity-centric platform: every claim carries its own source and tier, reconciled across sources that disagree on what a building is called, how a unit is referenced, and which currency a price is in. The deployed instance was mid-reingest at 40K+ entities and 599K+ claims from 9 completed connectors; the platform has 115 connectors registered across 12 countries, and the full local database has since passed two million entities. Data Centre's job is to make them agree without lying. On top sits the AVM Tool: type an address, read back a valuation with confidence bands, DLD comparables, a six-month forecast, and an investment score. The entity model predated this engagement; the front end, the design system, and the valuation engine's accuracy work (leave-one-out backtesting, confidence-band recalibration) did not.
Phase two, a separate engagement: the broker-prospecting tool, a PHP monolith holding ~840,000 property-ownership records, had never had a real front-end pass. Not a rebuild: a page-by-page audit taken through to merged releases against the production app.
The brief.
Collapse the valuation team's multi-day analyst brief into an on-demand surface without averaging away the disagreements between the nine sources that completed an ingest, out of 115 connectors registered, then bring the same design standard to an interface a different team uses every day.
What it took
Skills behind it.
Primary discipline plus the support stack.
Skills demonstrated
- Frontend Engineering
Reworked the valuation front end with a new design system: the React and MapLibre pin-picker, the DLD-comparables panel, and the accuracy-snapshot dashboard. Carried the same system into the broker-prospecting surface as production polish.
- Web Design
Design-system baseline plus a page-by-page audit that became a full audit-to-implementation sweep of tokens, icons, modals, and states.
- Product Strategy
Tested the broker-facing UI and UX in repeated sessions with individual brokers, and set up a feedback loop every broker in the company can use, so changes shipped against what brokers actually ran into.
- Data Pipelines
Helped restructure the data and supported ingestion and configuration as the entity count scaled to 40K+ across 9 sources, and worked on the bulk ingestion and normalisation pipeline as coverage grew.
The build, in full.
How it came together, the decisions on the record, and the design system - kept off this page so the case study stays a read, not a scroll.
Read the full build notesWhat shipped.
The valuation side turned multi-day analyst cycles into an on-demand AVM brief and surfaced ranked opportunities with an accuracy snapshot the valuation team could audit. Data Centre ran over ~840,000 property-ownership records until BARNES Dubai ceased operations in 2026. The design work was a page-by-page audit taken through to merged releases against the production app, a design-token baseline, a WCAG AA contrast fix, and a table-list rewrite that removed a load timeout. On top of it sit the analytical surfaces: an Insights panel with per-community transaction prices and sale velocity, a view of the largest holders by unit count, a live data-quality page, a per-user recently-viewed trail, and an admin valuation demo that estimates from comparables.
Used by the BARNES Dubai valuation team until operations ended in 2026. The AVM Tool replaced the manual cycle with an on-demand brief, freeing the analyst to spend time on the harder cases instead of repeating the same lookup, and refusing to answer confidently when fewer than three comparables supported the estimate. Data Centre ran over ~840,000 property-ownership records for the broker-prospecting team, with the audit fully shipped rather than left as a report.
leave-one-out backtest, July 2026, n=121 held-out sales
deployed snapshot, reconciled across sources
registered across 12 countries; registry, geospatial and portal feeds
after recalibrating the confidence bands
Data Centre, per-unit read model, growing with each ingest
with CI on every push
The paper-to-product thread this project sits inside. The full chain, paper through benchmark to shipped, is on the thread.
- Data CentreSee thread
An on-demand automated valuation model reconciling disagreeing Dubai real-estate data sources into one auditable number.
See also
Barnes Dubai LLM
A domain-tuned language model for a Dubai brokerage, answering in seconds the market-comparison brief that used to take an analyst an afternoon.
Barnes Dubai Dev Portal
The internal cockpit BARNES Dubai's innovation programme ran on: project tracking, analytics and a marketing-engineering toolkit in one place.